Explore US electricity generation (EIA)
This tutorial walks you through installing datasight, loading US power plant generation data from the PUDL project, and asking your first question. Allow about five minutes.
For other datasets, see Explore EV charging demand with TEMPO or Try the time-validation demo.
1. Install
Don't have uv yet? See Install datasight for the one-line installer. This includes DuckDB, SQLite, PostgreSQL, Anthropic, GitHub Models, and Ollama — no extras needed.
2. Download a demo dataset
The eia-generation demo downloads US power plant generation data (~50 MB)
from the PUDL project:
This creates a project directory with a DuckDB database, a schema description, and example queries already wired up.
3. Add an API key
Edit .env in the project directory and add your Anthropic key:
Using GitHub Models or a local Ollama instance instead? See
Set up a project for the alternative
.env configurations.
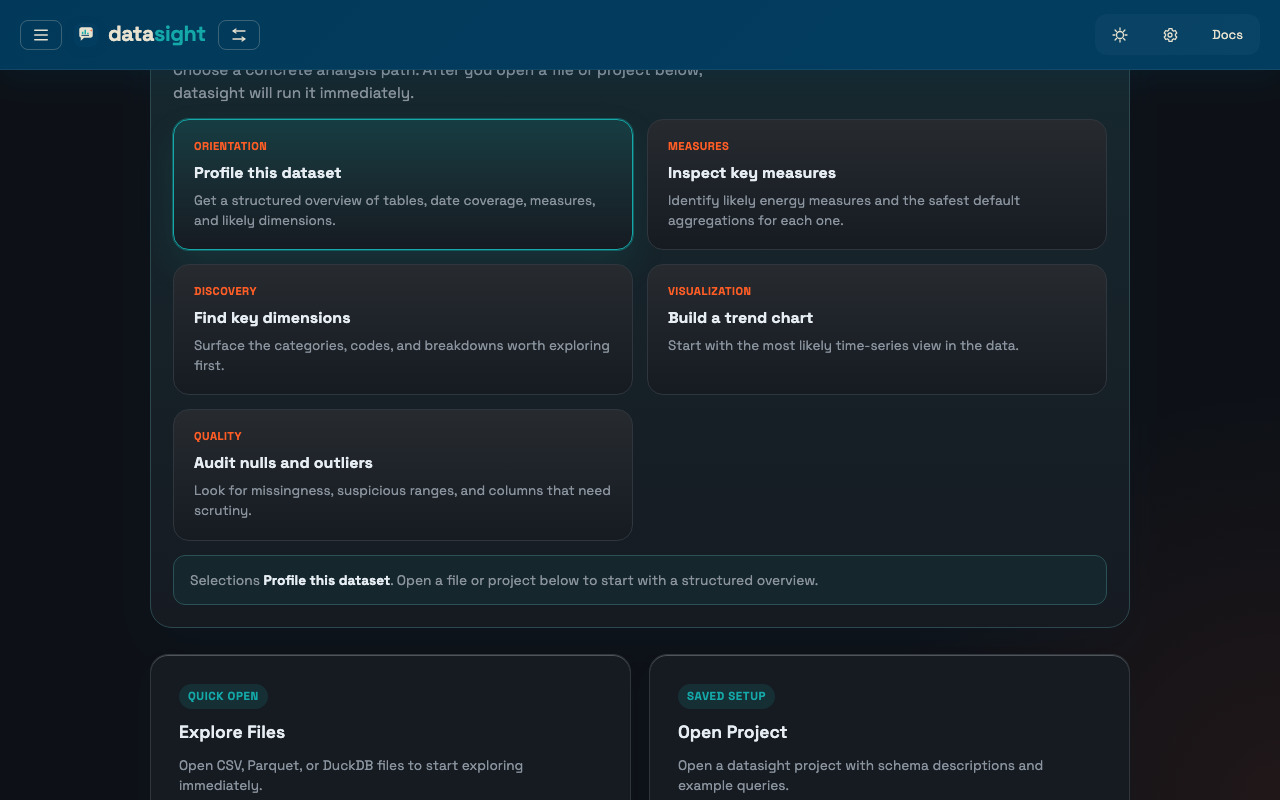
4. Launch the web UI
Open http://localhost:8084. The sidebar shows the loaded tables, example queries, and deterministic inspection tools.
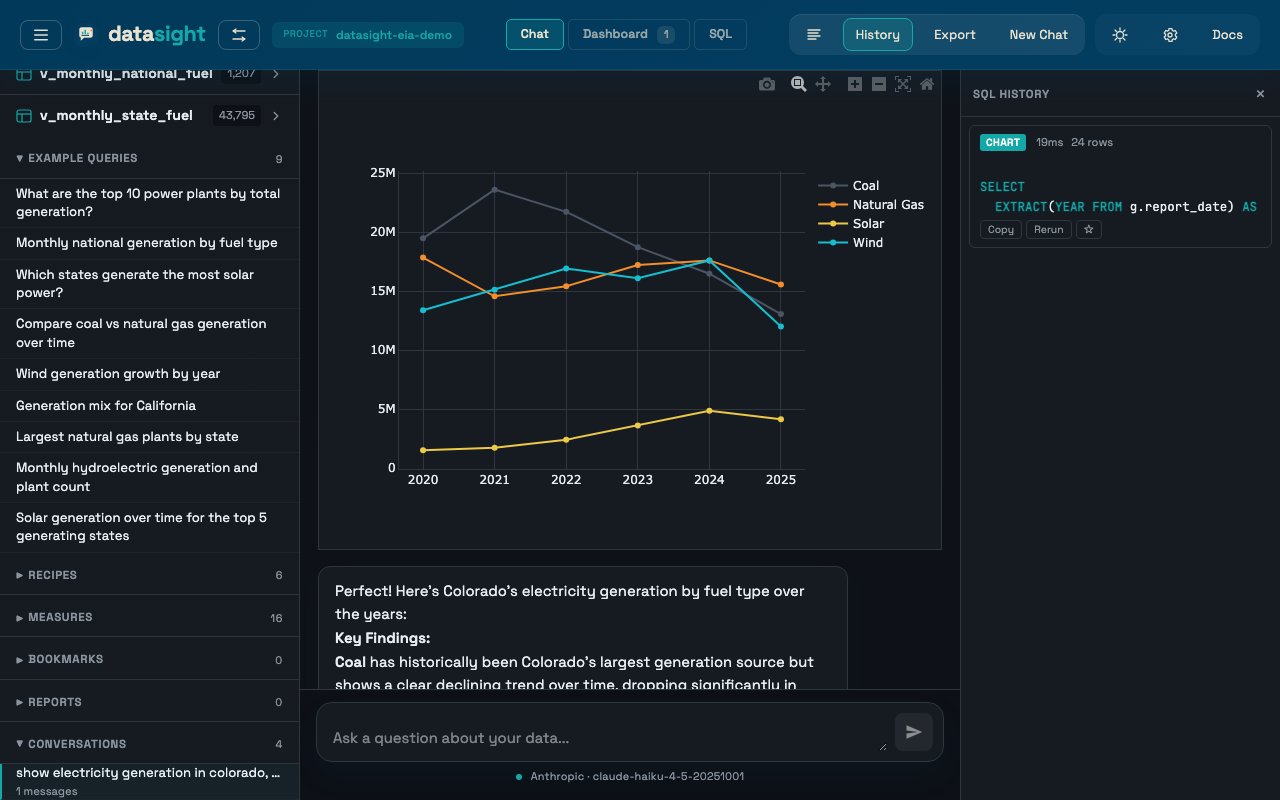
5. Ask your first question
Type a question in the chat input — try one of these:
- What are the top 10 power plants by total generation?
- Show me the monthly trend of wind generation
- Compare coal vs natural gas generation over time
datasight writes SQL, runs it, and returns a table or an interactive chart. Click Pin on any result to add it to the dashboard.
What's next
- Explore more questions. Ask questions in the web UI covers follow-ups, clarifying prompts, and the schema sidebar.
- Build a dashboard. Build a dashboard shows how to pin results, apply cross-card filters, and export.
- Use your own data. Set up a project walks through connecting your own database or files.
- Explore files directly. Explore files without a project skips project setup entirely — point datasight at a CSV, Parquet, or DuckDB file and start asking.
PNG chart export
The datasight ask --chart-format png CLI command needs the optional
export extra. Reinstall with:
uv tool install "datasight[export]".
The web UI uses interactive HTML charts and does not need this.