Ask questions in the web UI
Once datasight run is open in your browser, you can load data, navigate the
schema, and chat with the AI. This guide covers the day-to-day question
workflow. For the full catalog of UI controls, see the
web UI reference.
Load data
From the landing page you have three entry points:
- Guided starter — pick a workflow like Profile this dataset or Audit nulls and outliers before loading data. datasight runs the starter as soon as your data loads.
- Explore Files — enter a path to a CSV, Parquet, or DuckDB file (or a directory of Parquet files) and click Explore.
- Open Project — click a recent project or enter a project directory
path. A project directory must contain
schema_description.md.
If no LLM provider is detected, you'll be prompted to enter an API key before going further.
Explore the schema
The left sidebar lists your tables. Click a table name to expand it and see its columns with types.
- Schema search — the search box above the table list filters both table names and column names. Column hits auto-expand their table and highlight the match inline.
- Preview rows — click Preview rows at the top of an expanded table to see its first 10 rows.
- Column statistics — click any column name to see distinct count, null count, min, max, and average (for numeric columns).
Both previews and stats are cached in the browser and server, so reopening the same item is usually instant.
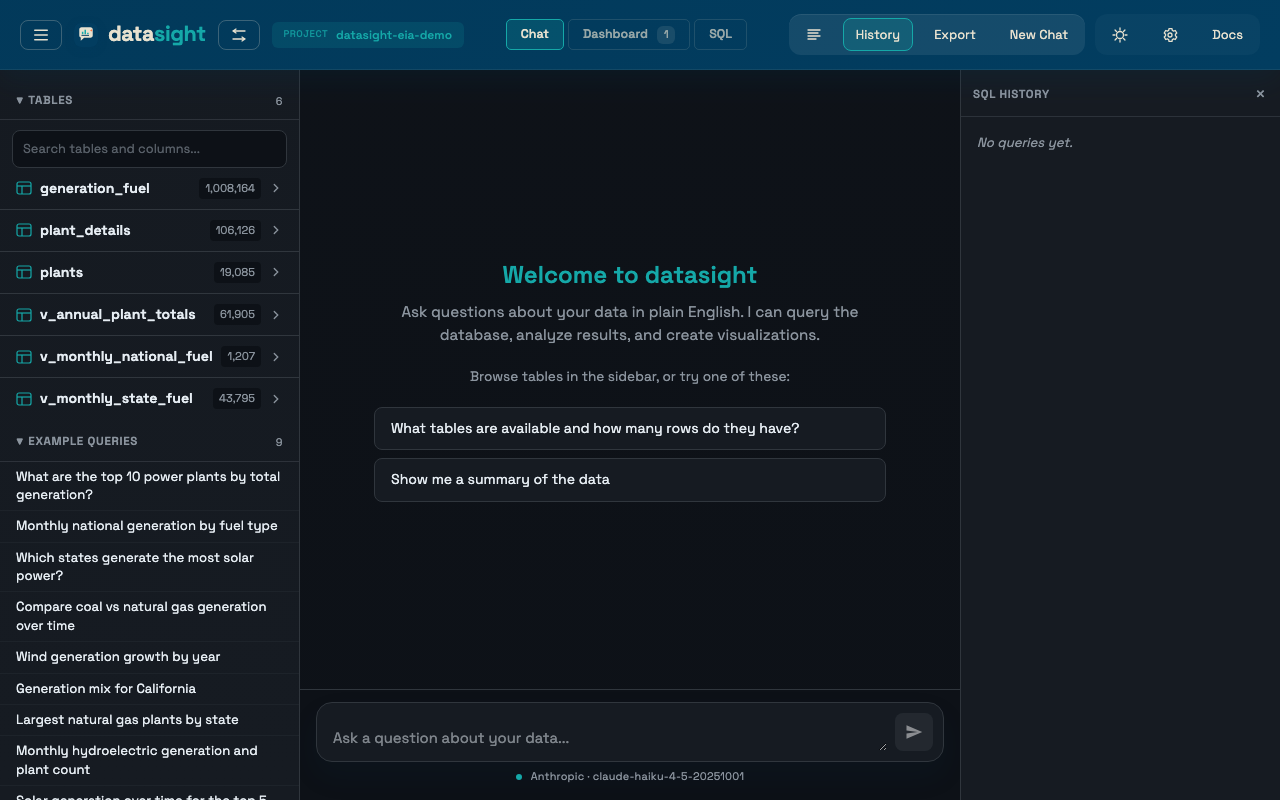
Ask a question
Type your question in the chat input. The AI writes SQL, runs it, and returns either a table or an interactive Plotly chart. After each response it suggests 2–3 follow-up questions as clickable buttons.
If your project has a queries.yaml file, example queries appear in the
sidebar. Click one to populate the input. When a table is selected, only
queries relevant to that table are shown.
Prompt recipes
The Recipes sidebar section contains reusable prompts generated from the loaded schema — profile the biggest tables, break down by a likely dimension, start with a trend analysis, summarize a likely measure. Click a recipe to load it into the chat input, then edit or send it.
Inspect tools
The Inspect sidebar section gives direct access to the deterministic inspection flows that power the guided starters: Profile dataset, Key measures, Find dimensions, Quality audit, Trend ideas. These are useful after a project is already loaded — you can rerun them without going back to the landing page.
If a table is selected, the section also offers table-scoped actions (Profile selected table, Dimensions on table, and so on). The scope label at the top of the section shows whether the action will run on the full dataset or the selected table.
Save an explore session as a project
After exploring files, the header shows an Explore indicator and a
Save button. Click Save to persist the session. Enter a directory
path and optional name. If an LLM is configured, datasight auto-generates
schema_description.md and queries.yaml in the background and seeds a
measures.yaml scaffold from the inferred semantic measures.
Switch between projects
Click the datasight logo or the switch icon in the header to open the project switcher. You can start a Quick Explore, pick a Recent project, or enter a path to open a new project.
When you switch, datasight loads the new project's .env, connects to its
database, loads its schema and example queries, and clears the current chat
(previous conversations remain in History).
Configuration inheritance
LLM settings (API keys, model) can come from either the startup
directory or the project's .env. Database settings always come
from the project's .env.
Work with results
Tables
Result tables support:
- Sort — click any column header to sort ascending/descending
- Filter — type in the filter input above the table to narrow rows
- Pagination — large results are paginated (25 rows per page)
- CSV export — click Download CSV to download the visible data
Charts
Charts render as interactive Plotly plots. Use the chart toolbar to switch chart type (bar, line, scatter, pie), edit the title and axis labels, or save the Plotly JSON spec. See Create visualizations for prompt patterns.
Result provenance
Each live result card includes a Source disclosure with the originating question, tool type, row and column counts, execution time, chart type, and the generated SQL. Pinned dashboard cards preserve this metadata and exported dashboards include it as well.
Troubleshooting
"Maximum context length exceeded" or "request too large"
Your database schema is too large for the LLM's context window. This
commonly happens on the free GitHub Models tier (capped at 8,000 tokens)
when the database has more than ~20 tables. Ask your project developer to
limit the schema sent to the LLM
via a schema.yaml file, or switch to a provider with a larger context
window (OpenAI, Anthropic, or a local Ollama model).