Web UI reference
This page catalogs every panel, button, and section in the datasight web UI. For task-oriented walkthroughs, see the How-to guides.
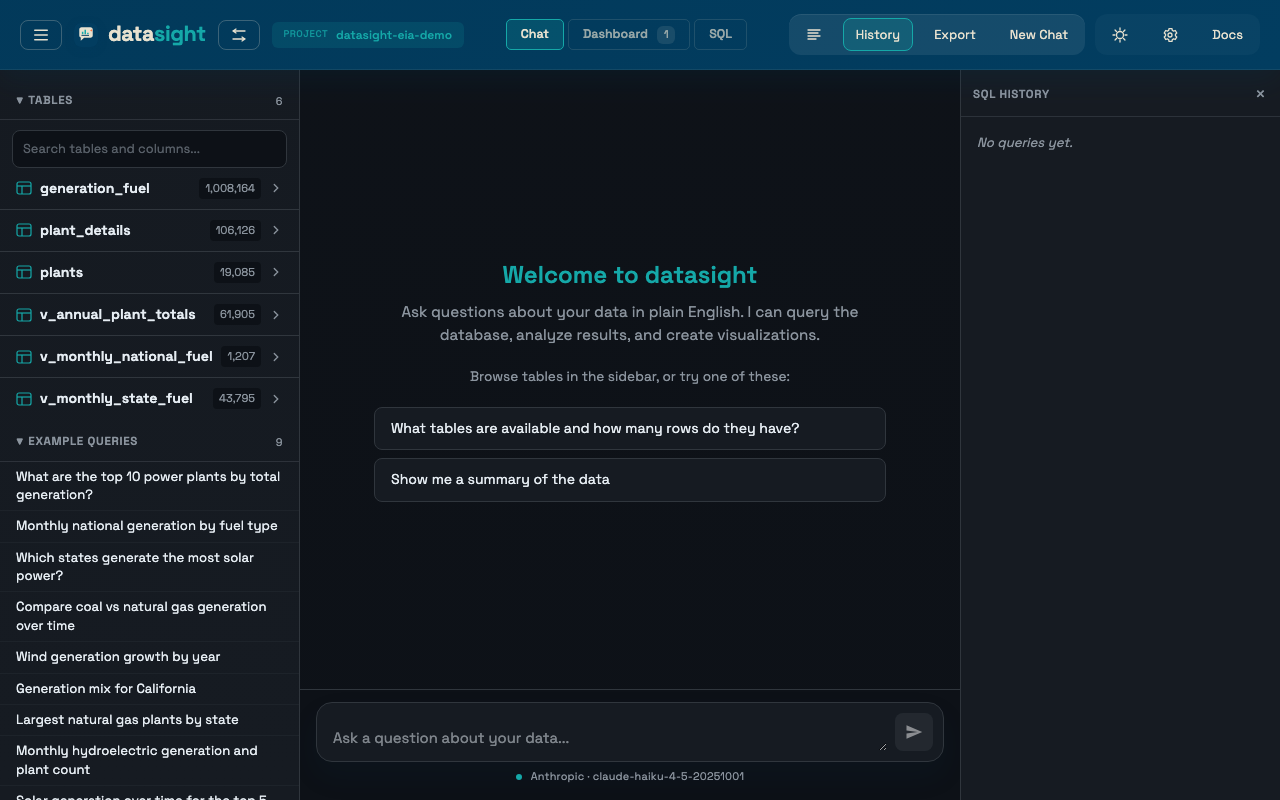
Landing page
Shown when you open datasight with no project loaded.
Guided starters
Four starter workflows that run immediately after data loads:
- Profile this dataset — deterministic overview of table sizes, date coverage, measure candidates, and likely dimensions
- Find key dimensions — likely grouping columns, suggested breakdowns, and join hints
- Build a trend chart — candidate date/measure pairs plus starter chart recommendations
- Audit nulls and outliers — null-heavy columns, suspicious numeric ranges, and quick QA notes
Starter results include follow-up actions (Inspect Top Dimension,
Build a First Trend, Profile <table>) that send a concrete
prompt into the chat workflow.
LLM configuration
Shown only if no LLM provider is detected from environment variables. Select a provider (Anthropic, Ollama, or GitHub Models), enter your API key and model, and click Connect. Disappears once connected. Can also be reached any time from the Settings panel (gear icon in the header).
Explore Files
Enter the path to a data file or directory:
- Single file —
.csv,.parquet, or.duckdb - Parquet directory — a folder containing
*.parquetfiles (hive-partitioned datasets) - DuckDB database — opens directly with all its tables
Open Project
Shows recent projects (click to open) and a path input for opening a
project directory manually. A project directory must contain
schema_description.md.
Project structure
A project directory contains:
schema_description.md— required, describes your data for the AI.env— optional, database connection and settingsqueries.yaml— optional, example queriesmeasures.yaml— optional, measure aggregation overridestime_series.yaml— optional, temporal structure declarations.datasight/— auto-created, stores conversations, bookmarks, and reports
Sidebar sections
Toggle the sidebar with the hamburger button in the header or Cmd/Ctrl+B.
| Section | Purpose |
|---|---|
| Tables | Database tables, column types, preview rows, column stats |
| Example queries | From queries.yaml, filtered to the selected table |
| Recipes | Schema-derived reusable prompts |
| Inspect | Deterministic inspection flows (profile, measures, dimensions, quality, trends) |
| Key measures | Inferred metric roles, default aggregations, rollup hints |
| Measure Overrides | In-app editor for measures.yaml |
| Bookmarks | Saved prompts — click to populate the chat input |
| Reports | Saved SQL — click to re-execute |
| History | Past conversations — click to replay |
Header
| Control | Action |
|---|---|
| Hamburger | Toggle sidebar |
| datasight logo / switch icon | Open project switcher |
| Chat / Dashboard / SQL tabs | Switch view (dashboard badge shows pinned count; SQL opens the query editor) |
| New Chat | Clear chat, SQL history, and dashboard |
| History button | Open the SQL query history panel |
| Log button | Toggle SQL query logging (highlights teal when on) |
| Export | Enter conversation export mode |
| Gear icon | Open Settings panel |
| Toolbar toggles | Clarify / SQL approval / SQL explanations (see Query confidence toggles) |
Settings panel
Open from the gear icon in the header. Configures:
- LLM provider, model, API key, and base URL
- Query behavior toggles (SQL confirmation, explanations, clarifying questions)
- Display options (cost visibility and run details)
Also includes a Project Health section that checks .env, LLM
settings, database configuration, schema_description.md, queries.yaml,
.datasight writability, and live database connectivity. Refreshes
automatically after major project/explore transitions.
Command palette
Press Cmd/Ctrl+K to open. Supports:
- view switching and panel toggles
- project switching
- schema navigation
- table preview and column stats actions
- starters and recipes
- bookmarks and saved reports
- conversation history
- dashboard composition actions
Query history panel
Click the History button in the header. Shows every SQL query executed in the current session — from the chat agent, from the SQL editor, and from rerun reports — with:
- tool type (SQL or Chart)
- execution time and row count
- expandable SQL with syntax highlighting
- Copy and Rerun buttons
- ★ button to bookmark the query
Failed queries are highlighted with an orange border.
SQL editor
Select the SQL tab in the header (or press S) to open a direct SQL editor over the currently loaded project or explore session. Useful when you want to tweak a query the agent generated, or write one from scratch against the ephemeral DuckDB of your CSV/Parquet files without leaving datasight.
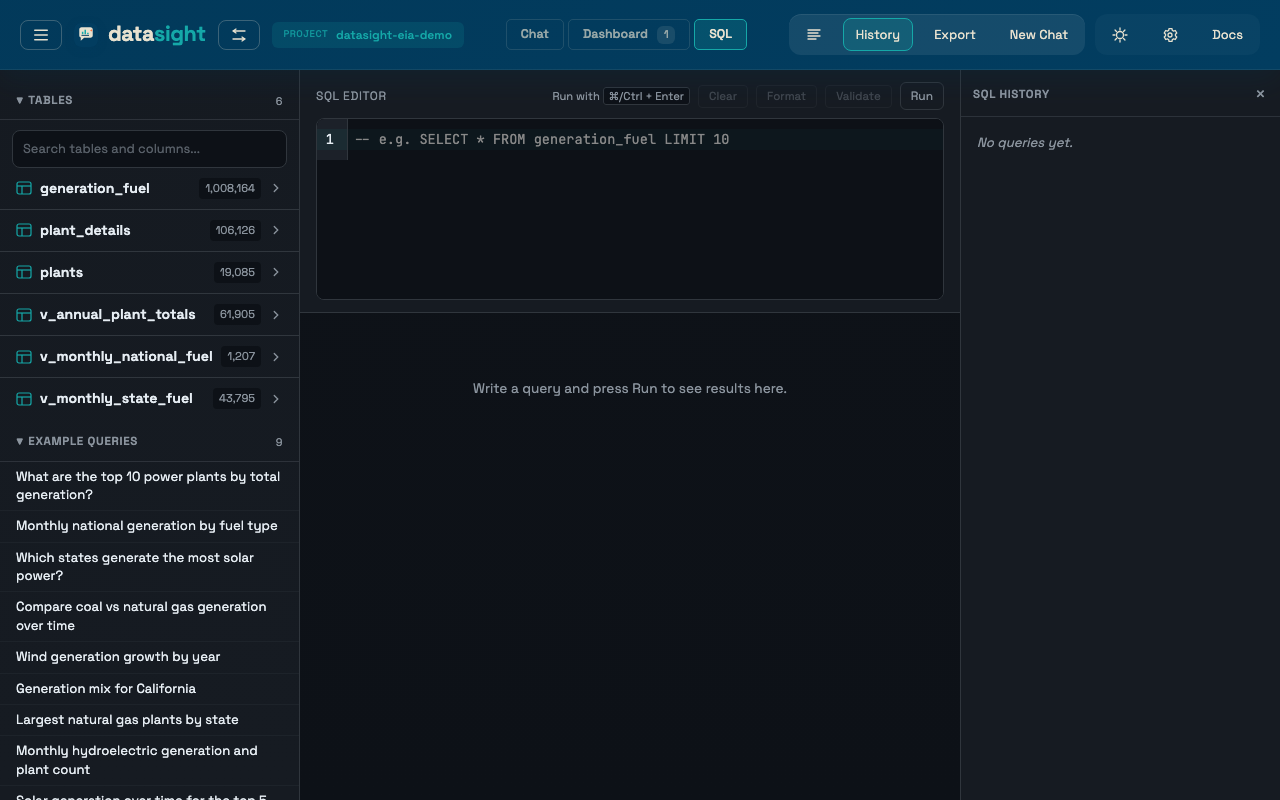
The page contains:
- a multi-line SQL input
- a Validate button — runs a sqlglot parse and checks that every referenced table exists in the loaded schema (no database round-trip)
- a Run button — executes against the active database. Cmd/Ctrl+Enter inside the editor runs the query as well
- a result table with filtering, sorting, pagination, and CSV export
- database errors and validation messages shown inline
The schema (tables and columns) stays visible in the left sidebar while you write. Each run is also appended to the Query history panel so you can copy, rerun, or bookmark it.
Tip
A typical flow: ask the agent a question in Chat, copy the generated
SQL from the query history, switch to the SQL tab, paste, and edit
— for example, broaden a WHERE report_date >= '2024-01-01' filter
or add a GROUP BY energy_source_code to the agent's
net_generation_mwh query.
Result provenance
Pinned dashboard cards include a Source disclosure showing:
- the originating question
- tool type
- row and column counts
- execution time
- chart type
- generated SQL
The chat view can also show a Run details disclosure after each result. It is off by default. Enable Settings -> Query Behavior -> Show Run Details to show copyable provenance for new and replayed conversation turns. The disclosure includes validation status, execution metadata, formatted SQL, model, token usage, and Copy JSON / Export JSON buttons.
Set SHOW_PROVENANCE=true in .env to make run details visible by
default. Session HTML exports include run details when the conversation
contains provenance events.
Related reference
- CLI reference — every
datasightsubcommand and its flags (coversrun,ask,demo,inspect,quality,log,export, and more). - Configuration reference —
environment variables for
.env(LLM provider, database connection, query behavior, project files).